
![]()
![]()
![]()
![]()
![]()
![]()
![]()
![]()
![]()
![]()
![]()
![]()
![]()
Archives & Museum Informatics
158 Lee Avenue
Toronto Ontario
M4E 2P3 Canada
ph: +1 416-691-2516
fx: +1 416-352-6025
info @ archimuse.com
www.archimuse.com
| |
Search A&MI |
Join
our Mailing List.
Privacy.
published: March 2004
analytic scripts updated:
October 28, 2010

Integrating Databases with Maps: the Delivery of Cultural Data through TimeMap
Ian Johnson, University of Sydney Australia
Abstract
TimeMap is a unique integration of database management, metadata and interactive maps, designed to contextualise and deliver cultural data through maps. TimeMap extends conventional maps with the time dimension, creating and animating maps on-the-fly; delivers them as a kiosk application or embedded in Web pages; links flexibly to detailed content in Web pages and databases; connects to a wide variety of data sources, including textual databases and scanned historical maps, situated anywhere on the Internet; and allows locational data to be captured in a Web browser.This paper presents an overview of TimeMap, focusing on the flexible data model and metadata-based methodology which allow TimeMap to integrate seamlessly with existing databases and fulfil a wide range of application needs from museum kiosk to digital cultural atlas. Example applications include the Sydney TimeMap museum kiosk, MacquarieNet on-line encyclopaedia, Fairfield multicultural tourism Web site, UNESCO World Heritage Sites database, and a map animation of the Khmer Empire.
The paper also addresses some of the issues in handling complex datasets effectively on low bandwidth connections, and shows how TimeMap has addressed these through on-demand data loading, server-side filtering, dynamic map legends and dynamically constructed hotlinks.
Keywords: Time; GIS; Web mapping; Database integration; Java applets; e-Publishing; Animation.
Introduction
This paper is about the integration of maps and databases, and the use of maps as a front end to rich cultural information. While static maps — and, to a lesser degree, purpose-built animated maps and interactive multimedia with fixed content — are commonplace in museums and on the Web, the use of interactive maps built on-demand from content-rich databases and the incorporation of time as an essential element of historical maps are altogether less common. This paper will briefly review the strengths of interactive time-enabled maps and obstacles to their wider use, and outline the methods developed by the University of Sydney TimeMap Project (www.timemap.net).
Why Maps, Why Databases?
Few people would deny the utility of maps as a means of contextualising cultural data, and fewer still would deny the utility of databases in keeping track of the vast amounts of information we all collect. Yet maps and databases are rarely integrated outside the Geographic Information System (GIS) community.
While the maps we see in museums, in print, on TV and on the Web are increasingly constructed using GIS — the integration of databases, maps and spatial analysis — they are most often presented as static images (animated weather charts being a notable exception). Web-based mapping is becoming common for geographic and environmental data, but has been relatively little exploited for cultural and historical data. On-line databases are commonplace, but most searches are still text-based, and results are generally displayed as lists even if leavened with images or multimedia.
Yet maps not only provide an effective means of delivering cultural data (Johnson 2002:1), but also provide a means of displaying lists of resources [i] in a more engaging, coherent and comprehensible fashion, and an unambiguous method of searching for relevant information. As physical beings we routinely use mental and physical maps —whether going on holiday to an unfamiliar place or simply fetching a spoon from the kitchen drawer — to understand our surroundings and to find things of relevance to our needs or interests. In On the Internet, Dreyfus (2001:21) observes, “Our embodied concerns so pervade our world that we don't notice the way our body enables us to make sense of it”. Egenhofer points out the weakness of textual searches as providing “no support for any deeper structures that … people typically use to reason” (2002:1). Time and place are fundamental to our understanding of the world, the items it contains, the way things came about, our immediate concerns, and our future trajectories.
Maps provide an interface which is more consistently understood, less ambiguous, more portable across cultures and more grounded in our experience than classification, search terms and ordered lists. The latter aim to simplify the complexity of the real world, but they are only useful to a constrained social and cultural group. On the other hand, we need only to be able to implement definitions of latitude and longitude — scarcely an issue today — to bring all spatially-located information into a common framework and to agree on a spatial search. While methods of representation, such as projection, symbology and choice of data, may substantially condition the message transmitted (see Monmonier 1996: 94-107 on the use of maps for propaganda), maps also provide a rich and concise means of delivering large volumes of information from a database back-end.
By building explicit programmatic methods for map construction on top of a database, rather than hand-crafting a multimedia resource from a fixed set of content, one has the flexibility to expand, enhance, redesign or even repurpose the package without starting again from scratch. Our aim with TimeMap has been to develop generalisable methods rather than specific solutions, so that a wide variety of interactive map-based kiosks and Web sites delivering historical data in spatial and temporal context can be developed with little or no programming.
What is a Time-Enabled Map?
There are a number of conventional mapping methods for representing change through time which can be seen in historical atlases such as the Concise Atlas of World History (O'Brien 2002) or the Atlas of World Archaeology (Bahn 2000): period maps, time symbolisation, change maps and annotation. These methods are static and have problems displaying very complex or detailed overlapping information, particularly where features undergo many small changes or change continuously through time (administrative boundaries and the extent of empires are examples of such temporally and spatially complex objects).
Date Stamping and Filtering
Computers allow us to generate maps on demand so that we can set a time range and more-or-less instantly see what falls within that range. TimeMap implements this method of time-enabled map display through a time selection bar (Figure 1) and filtering of the source data to display only those features which fall within the time range selected [ii] . TimeMap will also step through a sequence of time ranges to display through-time changes on the map interface or to generate an animation file which can be played separately or embedded in a Web page.

Figure 1: Time Selection Bar
Many datasets can be handled with simple date stamping along these lines, and such date stamping is often already available within databases of historical information as start/end dates, a simple median date or an event date. Simple date stamp filtering works well for items which occur at a specific time identified by a date or date range (such as historical photographs), or exist unmodified over a period of time (such as particular administrative boundary configurations), but is less effective for items which change continuously during their period of existence (such as empires or cultural areas).
Snapshots and Interpolation
In practice, our knowledge of historical data tends to be episodic and partial, so that we know the position, extent or attributes of a map feature — a “snapshot” of the feature — at various (arbitrary) times, but do not have specific information on what happens in between [iii] . We can make some estimate of intermediate conditions through interpolation of extents or attributes between the available snapshots (Figure 2).

Figure 2: The snapshot-transition model of a feature (viewed in a 'space-time cube'): snapshots (left) and interpolated sequence (right)
In the absence of other information, such interpolation would normally be linear between the known snapshots. However we may have enough information about the nature of the phenomenon to record a qualitative modifier, such as “increasing pace”, or even a quantitative modifier which could be used to improve the interpolation. Furthermore, the dates of the snapshots may be subject to uncertainty, as may the accuracy of the extents or attributes recorded, and all of this information should really be recorded and used in the generation of interpolations. I refer to this method of recording spatio-temporal information as a “snapshot-transition model”, and refer to the individual observations of features at arbitrary times as “instances” (Johnson 1999).
Model-driven Interpolation
While modifications to the interpolation of features recorded using a snapshot-transition model may produce a better match with what actually occurred, such interpolations are still just mathematical transformations which take no account of what actually happened, and the degree to which they match reality can never be known. The only way to generate interpolations which approximate reality, within some quantifiable error, is to model the processes which resulted in change, taking account of factors such as landscape characteristics, social organisation, economics, communication and specific events. The model might then be tested against actual observations - the snapshot observations.
Such an approach requires far more knowledge and far more data than is generally available for historical periods, but should not be excluded as a means of refining interpolations. The development and refinement of such a model may also be a valuable method for better understanding and interpreting the phenomena mapped, as well as delivering visualisations for explanation and education.
Map Animation
Map animations generated either by simple geometric interpolation of instances (tweening) or through a model-driven interpolation provide a powerful and engaging means of communicating information about mappable historical phenomena — distributions of sites and cultural domains, trade, exploration, spread of empires, military campaigns, urban growth etc. Unlike simple time date stamp filtering, animation works best where features DO change continuously (although they can also work effectively where there is patterning in the appearance and disappearance of substantial numbers of point features).
Map animation requires the interpolation of known spatial extents to generate intermediate 'frames'. For bitmap animation formats, such as AVI or MPEG, all intermediate frames must be generated, and the resulting files are very large even with compression. Our early small animations ran to tens of megabytes.
Vector animation formats such as SVG and SWF (Flash) can be rendered by a player which interpolates intermediate frames through tweening. This closely parallels the snapshot-transition data model adopted by TimeMap, so we can export an SWF file for tweening and animation by the Flash player, which can also be imported into Flash MX for refinement (see Jesse, 2001 for a similar approach). Because frames are built on demand and based on vectors, the size of these Flash animations depends on the amount of temporal and spatial detail, not on the playing time of the animation, and good quality zoomable animations running for several minutes are typically less than 1 MByte. Example animations are available on the TimeMap Web site.
Barriers to adoption
There are cogent reasons why the integration of maps and databases has not occurred widely. The high cost of software and data preparation and the need for technical expertise and facilities have been major hurdles. These technical and financial impediments to integrating maps with databases have by now been largely eroded, and most people have come in contact with database-generated interactive maps (without necessarily recognising the essential back-end behind the visual product).
The remaining barriers to widespread use of maps as a front-end to databases lie in awareness of non-demanding solutions and in seeing their relevance to providing more informative and more engaging interfaces for both search and display. One of our aims with the TimeMap project is to make database-driven map interfaces available, not as costly custom solutions, but as flexible search and enquiry systems which should be (almost) as easy and natural to use as images in a Web page.
Interactive Mapping Solutions
Web-based mapping is a growing field with many players and potential applications (for an overview see Kraak and Brown, 2001). At the lower end of the market there are any number of Java mapping applets—many available as freeware — which can be used to create interactive maps embedded in Web pages. Examples include ALOV [iv] , GAEA, GeoTools, JMapplet, JShape,lava, MapFactory and many others which can be located through a Web search. These applications — at least in their basic form — typically provide closed systems which download GIS data files stored with the applet, hold these in memory and allow various standard operations such as zooming, panning and enquiry. Like a Web page, you get all or nothing. These single-tier approaches are simple, but limit flexibility and entail heavy network traffic for rich datasets.
A number of these applet developers — along with digital library initiatives and mainstream commercial vendors — have also pursued a multi-tier approach in which the client can request data as required from a middle-tier server application. This approach gives greater flexibility to search for data through a clearinghouse, to add and remove layers, to pull data from multiple sources and to download data incrementally as a map is panned or zoomed. By isolating the complexities of data access and error handling on the middle tier server, the client applets can be simpler, smaller and more reliable, while network traffic is minimised.
The pre-eminent commercial multi-tier system today comes from ESRI Inc. Their Geography Network clearinghouse indexes (among other things) datasets served by their Internet map server (ArcIMS) to a variety of ESRI clients of various 'weights' (ArcReader ArcExplorer, ArcView, ArcGIS). Other vendors offer similar combinations of index, server and alternative clients.
Beyond these vendor-specific solutions, however, lies the potential for interoperability based on the Open GIS Consortium (OGC) standards (see www.opengis.org) which provide well-defined ways of finding, requesting and transferring data between data sources, catalogues, servers and clients. We should look beyond the traditional approach of building closed systems for specific applications — often developed independently, from scratch, as one-off applications — towards the building of systems which use adaptable tools and draw on external sources of rich data, such as mapping frameworks or institutional collections, and integrate them into new applications through standards-based interoperability.
TimeMap
TimeMap is intended to contextualise and deliver cultural data through maps. It is built around metadata stored in an SQL server DBMS, which allows data to be pulled in from servers anywhere on the Internet. To that extent it is similar in concept, although not in implementation, to commercial multi-tier systems. The biggest distinction from currently available commercial solutions lies in its explicit handling of the time dimension, informed by its roots in Humanities research (Johnson 1999).
The implementation differences lie particularly at the metadata level. Rather than a fixed set of metadata elements hard-coded into the software, TimeMap is a soft-coded system: the element definitions are recorded in the central server DBMS and can be consulted and used by each of the TimeMap programs. The definitions in the database can be easily updated; e.g. by changing their name or description or by adding additional schemes or permitted values, and these definition changes will be reflected in the software without reprogramming. The metadata is not limited to simply describing the data, but is used to configure the software to the data, rather than requiring the data to conform to the software.
At the core of the TimeMap system is a central, Web-searchable index of datasets [v] , the metadata clearinghouse developed for the Electronic Cultural Atlas Initiative (Lancaster & Bodenhammer, 2002). Datasets are spatially-referenced vector (point, line or area) data or raster images (scanned historical/modern maps, aerial/satellite images, digital elevation images) which may be located anywhere on the Internet and be in a variety of common formats [vi] . Figure 3 outlines the relationship between the different components of the system.

Figure 3: Structure of the TimeMap/ECAI application
TimeMap allows datasets registered in the ECAI clearinghouse to be combined and overlaid in interactive maps (“MapSpaces”), which are set up using the TimeMap Windows program (TMWin). TMWin will publish MapSpaces to the clearinghouse and they can then be embedded in a Web page as a fully interactive Java applet (TMJava) with a few lines of HTML. TMWin can also be used stand-alone as a MapSpace viewer or kiosk application.
TimeMap in Practice
TimeMap is made up of a number of components which combine to deliver a complete electronic publication system for interactive Web-based or kiosk maps. The system may be best understood through a description of these components.
Serving data
Preparing datasets for use by TimeMap can be as simple as placing a JPG image or an ESRI Shapefile on a Web server and entering metadata to register the URL in the clearinghouse. TMWin, the Windows version of TimeMap, provides wizard-driven creation of metadata, simple spatial registration of scanned images, creation of Shapefiles from spreadsheets, and loading of GIS datasets into a public domain SQL server (e.g. MySQL, available on many ISPs and university servers). This brings the creation of fully capable, Web-accessible spatial databases within easy reach of non specialists at little or no cost.
The ECAI Metadata Clearinghouse
The ECAI metadata clearinghouse was developed as a central metadata reference for Internet-accessible datasets which might be accessed by TimeMap (or other) software. Currently there is only one generally accessible clearinghouse, the Electronic Cultural Atlas Initiative (www.ecai.org) clearinghouse, but the software can connect to other clearinghouses (and is used with local XML versions for standalone applications).
The clearinghouse records three types of metadata (for more detailed discussion of these metadata categories, see Johnson, in press):
- descriptive metadata, based on Dublin Core, used to search for relevant datasets
- connection metadata — host, server type, passwords etc — to tell software how to access the datasets
- structural metadata (semantics) to tell software how to form appropriate requests to the data server.
The clearinghouse can be updated through Web-based forms (implemented in Perl and Python) or through the metadata editing and registration function of the TimeMap Windows software, TMWin .

Figure 4: Clearinghouse search.
The Middle Tier
The TimeMap clients (TMWin and TMJava) connect to individual datasets through a middle tier Java servlet which isolates data access, translation and authorisation control in a single easily controlled location. [vii] Multiple middle tier servlets can be implemented to scale the application, but so far the need for a mirrored or distributed index has not been felt.
e-Publication Toolkit
TMWin provides a complete solution for creating, serving and displaying interactive maps, including
- metadata creation, editing, upload (registration)and download
- upload (data pump) of local spreadsheet or vector data to an SQL server database
- download of data from remote servers and local caching for offline use
- construction and upload of XML files defining an interactive map (termed a MapSpace)
- display of MapSpaces in fully-functional or restricted mode, for research, CD-ROM or kiosk applications. [viii]
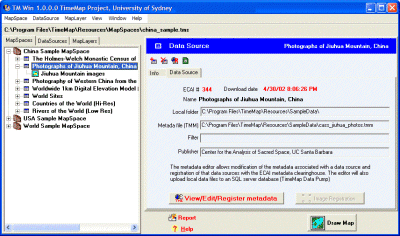
Figure 5: TimeMap Windows application (TMWin): MapSpace manager
Client Applications
The Java version of TimeMap (TMJava) is used to render the MapSpaces created by TMWin and registered with the clearinghouse (or served as files from a Web server). The clearinghouse can be searched through a Web interface (Figure 4) which includes a TMJava map built from the clearinghouse database. Datasets selected through this search can then be combined and rendered as a TMJava map (Figure 5).
Figure 6: Electronic Cultural Atlas Initiative Clearinghouse
search
(the map is an interactive TMJava applet generated from the clearinghouse)
TMJava will embed a MapSpace as an interactive map in any Web page, with most of the symbology and behaviours associated with the Windows version. MapSpaces can also be displayed directly in a TMJava applet simply by supplying the registration ID to a special URL, as in the following example: http://www.timemap.net/clearinghouse/html/alov.cgi?id=329
If the default layout of the applet is not suitable, the applet can be extensively customised through XML layout files and applet parameters, allowing exposure of different levels of functionality and changes to the look and feel of the applet to fit with existing Web page designs. The applet can also be controlled by JavaScript, allowing complete custom applications to be built without modifying the core software. Several examples of default and customised TMJava maps, along with simple embedding instructions for user-designed Web pages, can be found on the TimeMap Web site.
Figure 7: Search results from an ECAI clearinghouse search rendered in TMJava
Kiosk applications
It was always intended that TimeMap could function as a kiosk application, and our first kiosk (Figure 7) was installed at the Museum of Sydney in November 2000 (Johnson & Wilson 2002);. This kiosk is stand-alone, using resources generated from a central database and then copied to the kiosk computer itself.
 |
 |
| Figure 8: Museum of Sydney dual monitor pilot TimeMap kiosk (Nov 2000) | |
Work since then has aimed at creating a distributed kiosk system which draws data dynamically from a central server. The current Museum of Sydney system was implemented inTMJava, which renders MapSpaces built on-the-fly from selections made in a ThinkMap™ application connected to the central server database. Specific customisation was carried out to match the Museum's screen designs and desired workflow (Figure 9).

Figure 9: Museum of Sydney single monitor TMJava kiosk (Dec 2002)
Hot-linked content
One of the strengths of interactive maps is the ability to use the map as a portal to more detailed information This additional information may be the attributes (database fields) associated with the objects displayed on the map, or more detailed information such as database-generated Web pages or multimedia resources. Most interactive map applications now provide a means of hot-linking objects on the map to a disk file or a URL specified in a field in the attribute data, and in some cases support macros to generate a URL dynamically from information such as attributes and text.
TimeMap stores URL templates in the metadata attached to a dataset, which are then completed with attribute data when objects are selected on the map. This allows TMView and TMJava to easily hot-link to database-generated Web pages and systematically-named file resources, without the need to write macros.
TimeMap also handles hot-links from multiple layers, multiple hot-links per object and multiple object selection. When multiple objects are selected, a Web page of hyperlinks is generated from an HTML template. [ix] The templates allow the list of hyperlinks to include thumbnail images (as illustrated in Figure 6, right-hand screen).
Bandwidth issues
Bandwidth is a critical issue in delivery of Web-based resources. Owing to the potential size of GIS datasets, many Web mapping applications process the data server-side and deliver maps as JPG images. Each operations on the map returns to the server for a new image. This “thin client” approach can provide low-bandwidth solutions which sidestep problems with browser compatibility, but it severely limits interactivity. The TimeMap middleware can generate map images embedded in an HTML template if required for applications with minimal browser requirements or interaction.
At the other end of the scale, standalone map applets tend to download all the data to memory, even though much of it may never be displayed, and manipulate the data on the client — a “thick client” approach. While interactivity is enhanced, the bandwidth consumed may be out of proportion with the detail displayed.
TimeMap employs a mid-weight client which processes and filters data server-side, so that only the data needed to display the map is transferred across the network Several different approaches are adopted to minimise bandwidth. First, as layers are switched on or the map is zoomed or panned, the client works out what additional data it needs and sends incremental requests to the server. Secondly, map layers are scale sensitive, so that high resolution layers can be set to switch on only when the map is zoomed in, so that only a small part of the dataset is ever requested. Thirdly, MrSID image layers are filterable and multi-resolution, so the client requests images which cover just the visible window at an appropriate resolution. Finally, data is efficiently compressed before transmission.
Conclusion
In this paper I have attempted to summarise the TimeMap methodology, from its simple data model, core database and underlying metadata structure, to the practical implementation of e-Publication and Web map delivery tools. The implementation of TimeMap provides museums and other cultural organisations with a low cost, easily customised method of delivering rich content from databases, integrating external sources of data and taking advantage of spatial information and the power of maps to contextualise information.
This approach contrasts at one end with user-hostile text-based searching of catalogue databases, and at the other with user-friendly multimedia systems designed for a specific and limited purpose. Some may doubt that content-rich systems are appropriate to a museum environment, where quick turnover on scarce computer terminals may be desired. But as hardware becomes more ubiquitous, and the outreach of museums to the Web increases, the arguments for content-rich, Web-accessible multimedia generated from museum resources will increase.
TimeMap is a first, or perhaps second, generation system for delivering content-rich multimedia through Web browsers (whether on-site or viewed at home). In a few short years it will look primitive as 3D virtual environments become commonplace. But if it is built on sound database and metadata principles — as we hope it is — we can update the programming to integrate these new methods, rather than ditching the dated information architecture and software of a monolithic multimedia system. Our audiences may be becoming more sophisticated users of computers at break-neck speed, but that doesn't mean that their underlying questions and motivations are evolving like fruit flies: good structure and data today will be good structure and data tomorrow.
Endnotes
[i] Most collections of tangible or intangible objects have some inherent spatial distribution, whether it be provenance, reference or current location.
[ii] TimeMap handles both single date stamps and range date stamps, with available precision down to seconds and back to geological time. Date stamps can be recorded either as numeric values in years or as ISO 8601 format dates (e.g. 2003-01-15 12:57:21). BCE dates are represented as negative values. The date stamp fields are indicated through metadata fields giving the type of date stamping and the field names for the date stamp fields — field type is handled automatically.
[iii] Note: some authors refer to “snapshots” when all features are recorded at a given time — as in an aerial photograph or map — rather than snapshots of individual feature at different times according to availability of data — as in occasional observations of landscape conditions.
[iv] The current version of Java TimeMap, TMJava, is an extended version of the ALOV map applet. An earlier version was based on GeoTools.
[v] The index is implemented as an SQL server database with supporting web management and access tools in Perl, Python and Java, and is easily adapted to most SQL Server DBMS. Clearinghouses can also be exported to XML to allow the easy implementation of standalone systems.
[vi] ASCII text files, dBase, ESRI shapefiles, JPG images, MrSID image server, common SQL DBMS servers, OGC Web Map server.
[vii] TMWin also connects directly to datasets on a local network, whether registered with the clearinghouse or not, and caches Internet datasets to a local drive for offline use.
[viii] TMWin kiosk mode is triggered by a command line parameter or keyboard combination, and offers a substantially simplified interface protecting the underlying data from modification by the user.
[ix] Separate templates can be defined for each layer to override the MapSpace default, which in turn overrides the program default
References
Bahn, P. (ed.) 2000 The Atlas of World Archaeology. London: Time-Life Books
Dreyfus, H.L. 2001 On the Internet. London: Routledge
Egenhofer, M.J. 2002 Toward the Semantic Geospatial Web. Proceedings of the Tenth ACM International Symposium on Advances in Geographic Information Systems, pp 1-4 New York: ACM Press.
Jessee, C. 2001 Flash GIS: delivering geographic information on the Internet. Paper delivered at Digital Resources for Research in the Humanities. Computing Arts 2001, University of Sydney.
Johnson, I. 1999 Mapping the fourth dimension: the TimeMap project. In Dingwall, L., Exon, S., Gaffney, V., Laflin, S. & van Leusen, M. (eds) Archaeology in the Age of the Internet. British Archaeological Reports International Series 750. 21pp, CD-ROM.
Johnson, I. 2002 Contextualising Historical Information Through Time-Enabled Maps. Internet Archaeology 12.
Johnson, I. 2002 From metadata to animation: Web-based searching and mapping of cultural heritage information. Proceedings of UNESCO World Heritage Centre 30thAnniversary Virtual Congress. http://169.229.138.138/unesco/papers/3112_991-2002_10_unesco_alexandria.doc
Johnson, I. & Wilson, A. 2002 The TimeMap Kiosk: Delivering Historical Images in a Spatio-Temporal Context. In Arvidsson, J. & Burenhult, G. (eds) Archaeological Informatics - Pushing the Envelope British Archaeological Reports International Series 1016. Oxford: Archaeopress.
Kraak, M-J. & Brown, A. (eds) 2001 Web Cartography: developments and prospects. London: Taylor & Francis.
Lancaster, L.R. & Bodenhammer, D.J. 2002 The Electronic Cultural Atlas Initiative and the North American Religion Atlas. in Knowles, A.K. (ed) Past Time, Past Place: GIS for History. Redlands: ESRI Press. 163-177.
Monmonier, M.S. 1996 How to lie with maps 2nd ed. Chicago : University of Chicago Press.
O'Brien, P. (ed) 2002 Concise Atlas of World History. Oxford: Oxford University Press. 312pp.