Introduction
Context
September 12th 1940: discovery of the Lascaux cave system and its paintings and engravings, which date back to the Upper Palaeolithic period, making them 19,500 years old according to the most recent sources. From 1958 to 1962: 1,500 to 2,000 people visited the site every day. In 1963: site closed to the public following an invasion of micro-organisms and a whitening of the cave walls. At the same time, the public authorities prompted the creation of an International Scientific Committee under the impetus of the Minister of Culture, André Malraux, to ensure the collegial nature of the decisions taken concerning this heritage site of a universal dimension. Since then, measures of all orders have been taken and there has been constant surveillance of test monitoring zones, most of them on the decorated areas. In 1972: the caves become state property with the Aquitaine Regional Cultural Affairs Executive becoming the site authority. In 2001: rampant fungal contamination affects the floors of the caves.
The Need For A Condition Report
Faced with the extent of the problem and in the absence of reliable, thorough and systematic documentation concerning all of the walls, the conservation authorities found themselves without any means of comparing the current situation with the site’s previous condition.
There were no documents describing the general state of the caves, which could be compared over time with another vision of the evolution of the materials. Only major sectors had been defined – the decorated fields split into sections and named for the figures depicted, uniquely for use in archaeological studies.
The demand for a condition report is part of a whole range of actions implemented by the scientific Committee since 2001. Thus, a team was specially assigned to the treatment of the micro-organisms and several study programmes were launched to understand the phenomena involved.
The global condition report campaign of the walls and ceilings took place in the caves from January 2005 to April 2007. A dynamic condition report phase will be implemented during 2008.
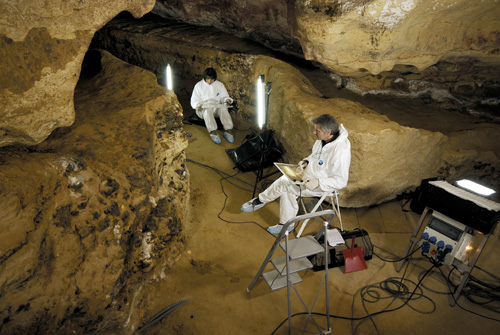
Figure 1: Information collecting work in the Passage
sector.
The Condition Report Tools
The Observation Readings Medium
Quite naturally, the demanding requirements in terms of the homogeneous and exhaustive nature of the condition report led us to consider as our first objective the creation of a quality visual medium for the forthcoming work project. To begin with, the use of the pre-existing 3D model of the caves was considered because of its highly interesting nature regarding the simplicity and framing of the images that can be extracted from it. But this solution was rapidly abandoned because of our relatively high image resolution requirements. Recording observations means that we need printed documents with a high level of details, and the 3D model did not offer this level of detail for the non-decorated zones. Photography seemed to be the obvious choice. Another constraint was that we needed a medium that was truly representative of the milieu. How can you represent a chaotic and complex space with a simple 2D image? Once on site, we noted that any observation support document, however regularly it is created, only gives a partial view of the volumes and physical phenomena present. Experience has often brought us face to face with the great difficulty later encountered in situating photographic documents –even for the person who took the photographs – because of the frequent absence of easily recognisable reference points, particularly in the non-decorated zones. Volumes are easily diminished, shots are often foreshortened, perspectives are truncated and the rendering of brilliance and colours is highly dependent on the lighting. Depending on their topographic situation, details may be brought out or melt into surrounding milieu. In addition, difficulties inherent to the milieu, often cramped and narrow or allowing too little space for shot framing, make it impossible to create visuals on an identical scale. The large amount of shot framing was incompatible with an optimisation of the time available on site. There is a long list of approximations produced during photographic shooting in such spaces, even if a standardised method is used, so that interpretation conventions emerge (direction of light, etc.) for an acceptable of relief. Indeed, photography is only the medium of condition reporting and, at a later stage, is supplemented by a succession of readings and note-taking, additional images, helping with comprehension and the removal of the inevitable incertitudes during the consultation process. Finally, the only elements validated are the observations that figure in the graphic observations and in the text commentaries.
Moreover, with its limitations, the photographic medium had to be integrated into a relatively simple system of grid referencing making it possible to locate elements in space. Our working base is composed of a sectioning as regular as possible, with a grid of an average size of around 1.8 m wide by 1.2 m high, but with extremes, depending on the possible objective distance or the accessibility of certain sites, from 70 cm by 50 cm for the smallest framing, to 2.5 m by 1.8 m for the largest. Moving from a spatial vision to a 2D vision obliged us to frame circumscribed zones, as a first approximation, on the flattest surfaces possible, in order to capture events face on in a perpendicular axis, according to the axis of the photographic objective. The difficulty and limitations of the method reside in an imperfect representation of the changes of plane or relief, which we would, however, like to embrace in a single piece as they are outstanding sites of the evolution of the substrata. The perimeters of each photograph or field of observation deliberately overlap onto the neighbouring fields in order to limit the effects of moving over to 2D. Tighter framing then emerges in the final document and the peripheral overlapping make it easier to move from one photograph to the next. This avoids, as much as possible, any eventual loss of information and responds to the objective of an exhaustive representation of the site.
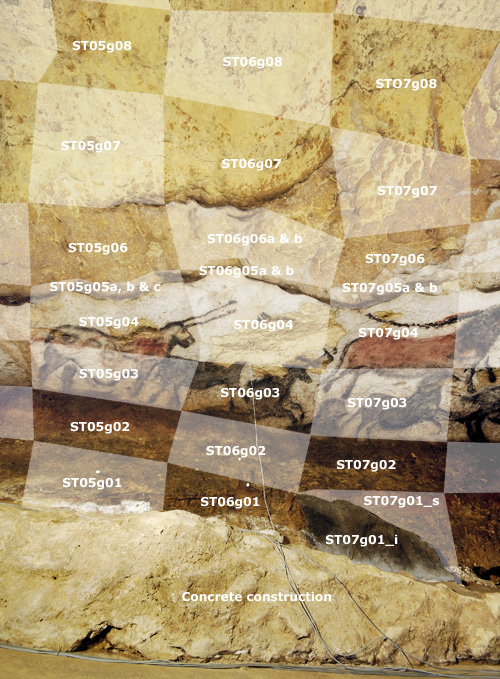
Figure 2: Principle of dividing up a portion of the
Great Hall of the Bulls.
Alongside this segmentation, a nomenclature designating each photograph is used as a basis for localisation in the caves and the unique assignment of all information, graphic reading and text note in the future database. In concrete terms, each image carries two letters for the zone where it features – for example, ST for the Hall of the Bulls (Salle des Taureaux) or NF for the Nave (Nef). The segmentation is by vertical blocks ordered in the direction into the caves, with each block then divided horizontally on the left and right walls. So, the photograph named DA06g03 is the third segment up on the left wall in the sixth block in from the entrance in the Axial Diverticulum (Diverticule Axial). Other nuances of notation are used for photographs too small to be considered as whole photographs in their own right.
Another aspect of the project is its systematic and dynamic monitoring, programmed over two years, of certain zones that are representative of the proven phenomena or chosen because of their fragility potential, or for their relative inertia. These zones are independent of the global segmentation of the caves and vary in size, depending on the objective sought for each of them.
The Glossary
The glossary lists the vocabulary specific to the Grotte de Lascaux condition report.
It defines the terms employed in the condition report commentaries and also serves as a reference for the text search engine of the resultant database.
It contains the terminology relating to geology with its Lascaux specific acceptation, to the selected observation criteria and the consultation base criteria. These are symbolised by representative photographic illustrations.
This vocabulary should be used by all of the team to describe the same events with the same words – this is a vital condition to ensure that the results of the text search are wholly pertinent.

Figure 3: Nave, left wall, Black Cow.
The Creation Of A Working Data Base
Initially, the information was recorded in computer files, for each of the fields observed, until all of the criteria were defined, grouped into four main categories: morphology, weathering, surface accumulations and links.
It was at that point that it became possible to formalise the text commentary files in a database, in order to use a systematic process to fill in the sections. Installed on a secured server accessible on line, each of the team members was able to work on the database at any time.
Four tables contain all of the data of the comprehensive condition report:
- General presentation: concerning the notices and user instructions for the database.
- Sector files: concerning the geological description of the six sectors we examined.
- Condition commentaries: these are the text-based doubles of the graphic readings, with an additional description of the morphological context extended to the neighbouring surfaces, and a section including the events observed in the stratigraphy (607 mentions).
- Glossary: providing information on the vocabulary considered specific to the condition report, with a definition of the words (138 occurrences).
The database also proved to be extremely useful in the management of our work. That is why other tables were specially created to this end:
- The weekly on-site condition report activity statement, which was very useful for transmitting information from one team to another and for the continuity of the work (117 mentions).
- The management of the state of progress of the different activities, such as the progress of on-site condition reporting, the progress of the edited commentaries in the database, the management of nomenclature variations, the progress of the photographic campaign and the availability of photo resources (625 mentions).
- The organisation of close-up photographs taken at the request of the conservators, listed on the graphic readouts. In particular, this table includes the characteristics of the photos, such as the nomenclature of the corresponding resource, the date, the scale and a brief description (426 mentions).
- The modifications journal gives information on the work sessions dedicated to the information already included in the database and the modifications made.
The On Site Condition Report
Condition Report Organisation
In preliminary exchanges, paired team working makes it possible to discuss and settle on the selected descriptive criteria, from one session to another and from one sector to another. When one of the observers designates a zone concerned by certain criteria, the second enters the indication on the read out with a different regard and taking care concerning the signs and conventions located on the photograph. Permanently shifting between the life-size object and its photographic representation helps to take the measure of the accuracy of a transcription of real events onto the two-dimensional representation. Already, the work is carried out bearing in mind the legibility of documents to be transmitted to third parties.
In the main, the pitfalls inherent to this method have to do with the fact that the diverse personalities of the conservators may interpret the same events in different manners.
Rigorously sticking as closely as possible to the jointly chosen vocabulary and avoiding making any interpretation of raw data are the means of guaranteeing the exhaustive nature, relevance and neutrality of the condition report.
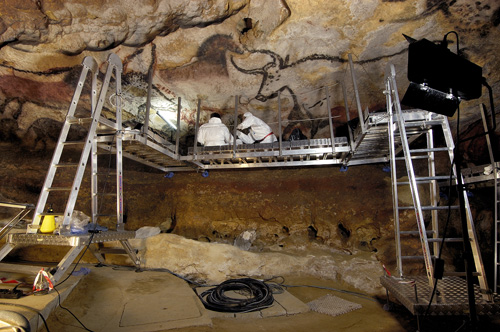
Figure 4: Scaffolding in the Hall of the Bulls, left
wall.
Definition Of The Geological Context
The geologist draws up general files per “sector”. They provide a global description, designating and naming the principal massifs of the sector and their constitution, describing the formation phenomena and their evolution, in order to provide the relative scales of the variation of the materials present.
By doing this, the geologist determines the suitable vocabulary for each visual event, providing the terms that are taken up in the text commentaries accompanying the graphic readings: a typology of the mineral features, a succession of strata following the logic of the formation of geological beds.

Figure 5: Nave, right wall, yellow ochre stag, graphic
readings.
Supplementary Requests
Apart from the graphic and text observations, other information may eventually be required in order to give more precise details concerning certain aspects. Most frequently, this involves taking additional photographs, either to show phenomena in extreme close-up using macrophotography, or to bring out a particular topographic aspect of the zone, or to provide greater legibility of certain volumes, which are not sufficiently explicit in the original photographic representation.

Figure 6: Nave, right wall, yellow ochre stag, detailed
view of figure 5.
The Graphic Reports In The Database
The process of editing the graphic readings provides an opportunity to review the limits of the fields of observation and, at the same time, the systematic overlap between the photographs. In this way, a certain number of shots were retaken to optimise framing.
The graphic recording of information is done with vectorial drawing software, according to a graphic legend drawn up in the initial stages of the condition report, at the same time as the glossary.
Ensuring Coherence Between Graphic And Text Content
The graphic readings editing process is carried out in a first stage. Initial corrections are made to the coherence of the data between neighbouring photographs or series of photographs of the same zone.
The graphics are then set against the body of commentaries: whatever is named should appear in design form and whatever is depicted must be named in the file.
When all the information is coherent and present, each referring from the graphic to the text and vice versa, the texts are polished in a simple, descriptive style, which sticks to the vocabulary in the glossary.
Starting from this significant and named material the images and texts are transformed so that they can be inserted into the multimedia reference database.
From this stage forward, the process of dynamic management of data takes over from the optimisation of the content of the proper condition report.
The data is ordered in a fastidious process of filling in columns, where, either nominatively or designated by geographic coordinates, the different items of information are declared; these will indicate to the software the links and information required by the reader.
The Data Consultation Tool
All the zones covered by the condition report give a body of more than 600 photographs, supplemented by the tracings, graphic readings of morphology, weathering, accumulations and links, leading to detailed views or notes. Associated with these are text notes on the geology, stratigraphy, sector presentation files, supplementary notes, references to other works or other bibliographic references and the results of laboratory analyses.
This body of information could not be properly consulted directly from raw sources without becoming off-putting and presented in the form of a volume of information that cannot be exploited. Hence the creation and the planned use, from the beginning of the project, of a computerised consultation tool and a tool of research and cross-referencing of the data gathered during the on site condition report.
The Different Methods Of Access To The Information
Ours was a twin problem; it involved making raw data accessible and intelligible for both those specialised in the site and novices. In fact, there is no typical user as requirements can differ greatly – either limited to a single field of research or, on the contrary, of an inter-disciplinary nature. With researchers and students trying to understand a particular problem, administrators, senior conservationists and conservation specialists, the public is very varied and the fields concerned are numerous and focused on diverse preoccupations. In addition to this, in the future, users should be able to enrich the content, on condition that they can find functions in the tool that are upgradeable and can be adapted to new demands.
The architecture of the consultation database has been designed around the principle of exhaustive content and in a spirit of homogeneity and weighting of observations, both in the visual and graphic context and the textual context. Use of the database is facilitated by an accessible interface, intuitive ergonomics and the availability of visualisation and search tools with a view to dealing with fine and crossed requests.
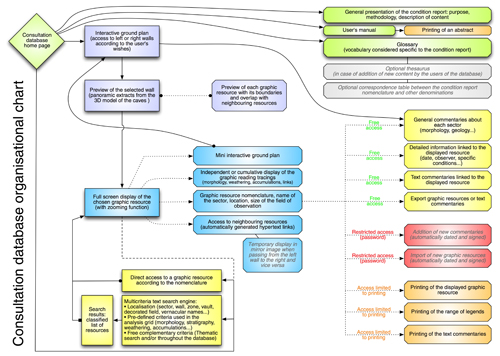
Figure 7: Consultation database organisational
chart.
Visual And Spatial Consultation
Direct access is offered based on a “geographic” approach, enabling users to view graphic survey readings and their associated commentaries on several levels – cave system, zone, wall, or precise spot – according to requirements. Alongside this, a conceptual and not just descriptive approach allows users to make themed and crossed searches and to highlight the existence of the conjunction of physical events or reveal trends in delineated zones.
Other sections provide access to the glossary used in the context of our work, to a global presentation of the project, its organisation and its methodology and, finally, to diverse possibilities of customising consultation.

Figure 8: Consultation database home page.
The first approach, intuitive and spatial, enables users to approach the cave system physically using an interactive ground plan where all of the halls or vernacular zones of the cave are represented. Each of these is subdivided into two parts, left and right, giving access to the relevant walls according to the user’s wishes.
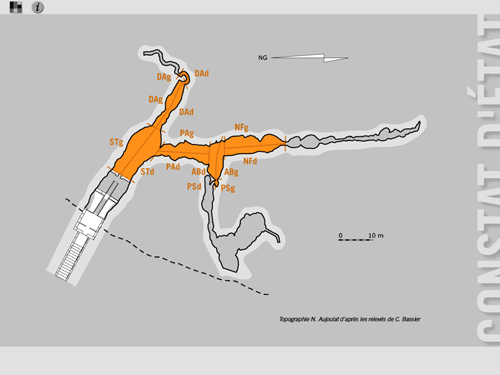
Figure 9: Choice of sectors on the cave system ground
plan.
A second level of visual approach is that of previewing the left or right walls via panoramic extracts from the pre-existing 3D model of the caves made by Cabinet Pérazio. The different graphic resources are represented by their surface barycentre (the average central point of the surface of the graphic resource), a sensitive zone for the computer pointer. Passing over this zone triggers the display of the preview of each graphic resource with its boundaries and its overlap with the neighbouring graphic resources. Once users have chosen the graphic resource, they only need to click on the link for direct access to the reading in full-screen mode.

Figure 10: Choosing a graphic resource from a panoramic
of the selected wall.
Once the image is displayed on the screen, a certain number of tools and menus enable users to discover the graphic and text information of the condition report and to navigate from one graphic resource to another, throughout the entire cave system and covering all the walls:
- The graphic reading tracings can be displayed at will, either independently or in a cumulative manner, for an isolated view or a confrontation of different phenomena (morphology, weathering, mineral or organic accumulations). An additional tracing is devoted to any eventual links to specific zones (macrophotography) or dedicated commentaries.
- A range of legends enables display of each of the three graphic conventions employed in the readings of the morphology, weathering and accumulations.
- The resource displayed is located on a mini ground plan of the cave system.
- A tool for navigating between resources is permanently available via automatically generated hypertext links naming the neighbouring resources. This tool enables users to move over a wall step by step, to move from one hall to another or browse over the entire cave system.
- For greater legibility of the continuity of phenomena on curved and vaulted walls, the resource is displayed in mirror image when passing from the left wall to the right and vice versa.
- A group of pull-down menus enables users to read the text commentaries linked to the resource, export or print them and to display the global file of the sector of the cave system.
- Various other functions are offered, such as the possibility of zooming in to 2 to 4 magnification in a reading, to print the displayed visual or export files.
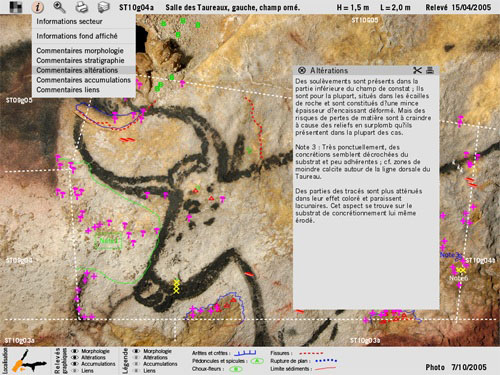
Figure 11: Consultation of resource ST10g04 in the Hall
of the Bulls.
Consultation By Multiple And Crossed Text Requests
The second principle approach to the consultation database calls for use of a multi-criteria text search engine.
The grid system used to section the cave system is a simple one, logical in hindsight, with which users rapidly become familiar. It enables users to consult a resource directly according to its nomenclature – a function designed principally for a direct search for a given resource.
Much more powerful and more interesting is another use of the consultation database with a text search tool, which enables cross-referencing between data through the selection of several criteria. Two approaches are proposed; one is system managed, the other free. The first offers the selection, with the aid of pull-down menus, of numerous pre-defined criteria, which are taken from the glossary and used in the analysis grid during observations in the cave system. The criteria are chosen for representative nature and relevance, particularly through a fine analysis of commentary content.
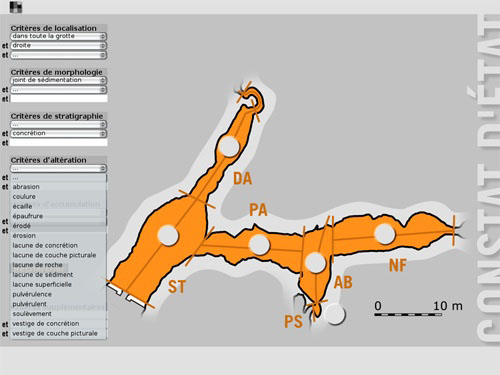
Figure 12: Multi-criteria text search by pull-down menus
and free fields.
The tool enables users to choose separately or simultaneously:
- The localisation, per sector or throughout the cave, the left or right wall, the zone, vault, decorated field, bench or inclined plane.
- A series of eight criteria for all of the sections used in the readings, morphology, stratigraphy, weathering and accumulations, covering all phenomena (designation, qualification of aspect, etc.).
The second approach supplements the search by proposing, for each theme, the opportunity to freely choose and determine complementary criteria. In addition, a search can be carried out in the entire database with up to three free criteria simultaneously.
Finally, without it being necessary to systematically fill in all the fields, whether for pull-down menus or free fields, the criteria can be associated with or opposed to each other.

Figure 13: Display of answers to a multi-criteria search.
The results of a search are displayed in a list of resources classified according to their nomenclature, with the possibility of exporting this for later use. A very simple statistical tool gives an indication of the quantity of readings obtained according to the sectors of the cave for a given search. This is definitely not a precise tool, either in terms of quantity or quality, but it does give an initial view of the absence or relative presence of a phenomenon or series of phenomena located on a ground plan and for each sector.
The Optimisation Of The Tool And Content
While the visual and spatial approach was relatively easy to implement and functioned almost perfectly right from the start, this was not the case of the textual approach. The first tests revealed semantic disparities, not all of which had been revealed during the first stage of polishing of content between neighbouring resources. Certain criteria led to irregular results with regard to our knowledge of the cave. A global analysis of all of the words used in the database revealed the use of words neighbouring those used in the criteria, or quite simply the errors in entering data, which are inherent to any work carried out by a group. So, a new re-reading phase was undertaken, with the systematic correction of all the commentaries, in order to be as close as possible to the search engine criteria, without removing any singular content. This singular content is brought together in numbered notes and located on the tracings.
Finally, through the rebound effect, this phase enabled us to refine the choice and hierarchy of the predetermined search engine criteria.
Conclusion
The Enrichment Of Content
The current database was designed so that the content could not be modified, on the basis that it was a condition report at time “T” setting out the perimeter of knowledge at a given time. On the other hand, and so that this work can be enriched over time, the integration of new layers of information can be envisaged with:
- New graphic content, with the creation of additional tracings on the readings – for example, the report on microbiological activity with follow-up over time.
- New commentary fields, in order to constantly enrich the text database.
- New search criteria.
- A thesaurus, which would become indispensable with the addition of new content, listing neighbouring words and words rejected from the glossary but which are employed by a wider public, and even wrongly spelled words.
In order to facilitate day-to-day use of the consultation tool, certain additional personalisation functions could be added, such as the possibility of creating sessions so that users could conserve their own working parameters, the results of their search requests and the integration of personal commentaries, without being able to modify the original content of the database.
Integration Of The Condition Report Database Into Other Tools
A first development envisaged is the creation of a gateway between the 3D model of the caves and our database, with the objective of moving from one tool to the other in a transparent manner.
A second, much more ambitious, development is the creation of a Geographic Information System or GIS, making it possible to federate the existing tools – condition report and 3D model – into a much wider body of work linked to all of the work and databases dealing with prehistory and the preservation of decorated caves.
The Creation Of A Preventive Conservation Tool
The creation of this multimedia database forced us to think in a dialectical manner about the descriptive quality of the visual events included in the database and the relative distance of the interpretation towards a precise diagnosis, probably because of the milieu the condition report was looking at: chaotic, constructed and perpetually evolving over a very wide time-scale, which induces a high level of complexity in the strata observed.
The concern with the transmission and openness in the exploitation of the data created by the condition report has provoked this permanent coming and going between the necessity to retain an item of information and the need to classify it and situate it in the consultation database. The limits of the evaluation criteria of walls have been tight, leaving the nuances and their interpretation in the numbered notes.
In addition to the centralisation of homogeneous knowledge of the state of the surfaces, extended to all of the walls, the objective is to mutualise other types of information, such as the microbiological studies, the hydro-geology studies, etc. By making this accessible through cross-referencing and confrontation, the database can be both for studies and prevention.
The text search tool is an important element. It enables evaluation of how widespread phenomena are, but it also enables statistical evaluation of the different states it presents, and always in a localised manner, for example, making it possible to note conditions that favour a particular state.
This information is available for teams with very different preoccupations:
- The cave staff in charge of daily surveillance, for example, taking note of the variations in the humid aspect of the walls, or the condensation gauges.
- The team of conservators in charge of treating and monitoring the microbiological activity. Ideally, they could eventually adopt our observation media and the shared vocabulary and could use the tool and enrich with their own observations.
- The different teams of researchers who have now set up study programmes are already interested in using the photographic resources with their nomenclature, which makes it possible to locate all the intervention sites and transmit them easily in the context of interdisciplinary exchanges. Some work zones have been chosen before visits to the cave system, with the help of the descriptions in the condition report, in order to limit the duration of human presence and reduce the risks of sudden changes in climatic conditions.
Acknowledgements
The permanent members of the Lascaux Committee Executive: Marc Gauthier, Committee Chairman, Alain Rieu, regional curator of historic monuments, Dany Barraud, regional curator of archaeology, Isabelle Pallot-Frossard, director of the LRMH, Jean-Michel Geneste, curator of the caves, Bernard Giraudel, heritage engineer, and Marie-anne Sire co-ordinator of interventions.
This work would not have been possible without the close collaboration of all of the team members: Anne Liégey, Laurence Blondaux, Christian Chatellier, Emmanuel Desroches, the ERM laboratory represented by François Rassineux and Damien Marchand.
References
Airvaux, J. (2001). L’Art préhistorique du Poitou-Charentes. Angoulême: La Maison des roches.
Aujoulat, N. (2004). Lascaux, le geste, l’espace et le temps. Paris: Le Seuil.
Bataille, G. (1955). Lascaux ou la naissance de l’art. Paris: Skira.
Breuil, H. (1952). Quatre cents siècles d’art pariétal. Montignac: C.E.D.P.
Brunet, J., Vidal, P., Vouvé, J. (1985). Conservation de l’art rupestre. Paris: UNESCO.
Brunet, J., Vouvé, J. (1996). La Conservation des grottes ornées. Paris: CNRS
Chauvet, J-M., Brunel Deschamps, É., Hillaire, C. (1995). La Grotte Chauvet. Paris: Le Seuil.
Delluc, B. & G. (2003). Lascaux retrouvé. Périgueux: Pilote 24.
Geneste, J-M., Hordé, T., Tanet, C. (2003). Lascaux, Une oeuvre de mémoire. Périgueux: Fanlac.
Leroi-Gourhan, A. (1971). Préhistoire de l’art occidental. Paris: Mazenod.
Roussot, A. (1994). L’Art préhistorique. Bordeaux: Sud-Ouest Université.
Sire, M-A. (2006). De l'élimination des champignons au constat d'état. Monumental. Paris: Monum.
Various authors (2002). "L’art avant l’histoire, la conservation de l’art préhistorique". Colloque de la SFIIC, Paris, 23-24 juin 2000. Paris: Errance.
Cite as:
Jallet, P., et al., The Lascaux Caves: A New Baseline For Better Risk Evaluation (A Multimedia Condition Report) , in International Cultural Heritage Informatics Meeting (ICHIM07): Proceedings, J. Trant and D. Bearman (eds). Toronto: Archives & Museum Informatics. 2007. Published October 24, 2007 at http://www.archimuse.com/ichim07/papers/dubarry/dubarry.html